The Infinite
Scroll
Pioneering the format of "scrollytelling"—integrating video, data, and design into a seamless narrative flow that shaped the future of digital journalism.
The Philosophy
"The web is not a series of pages, but a canvas for continuity. By breaking the grid and merging code with cinema, we created stories that didn't just inform readers—they transported them."
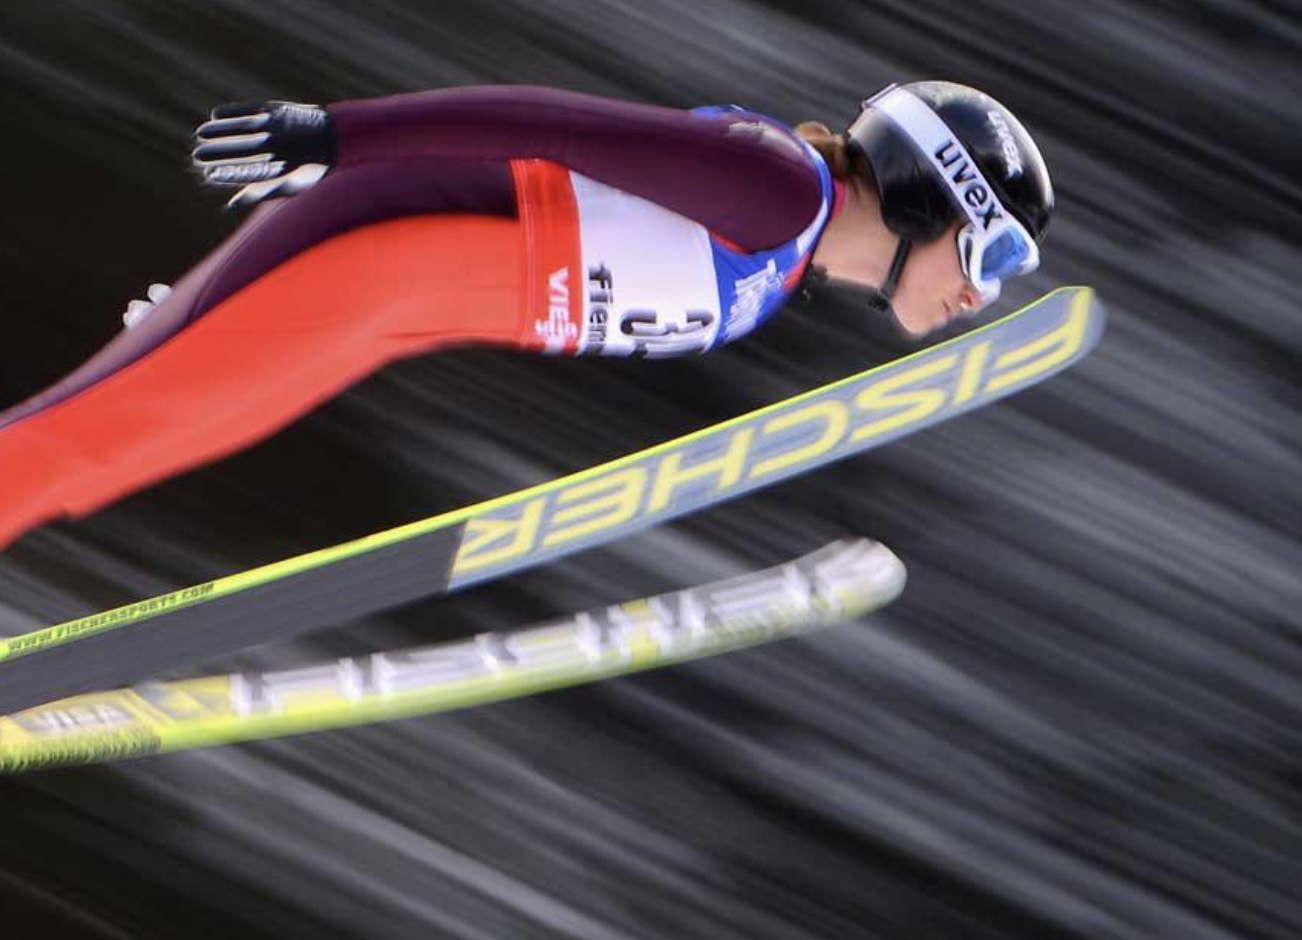
Snow Fall
The Avalanche at Tunnel Creek
Snow Fall was the project that coined the term "scrollytelling." We wanted to break the rigid CMS templates of the time to create a reading experience that felt as fluid as the events being described. The result was a seamless blend of text, video, and interactive graphics that moved with the reader.
Launch Experience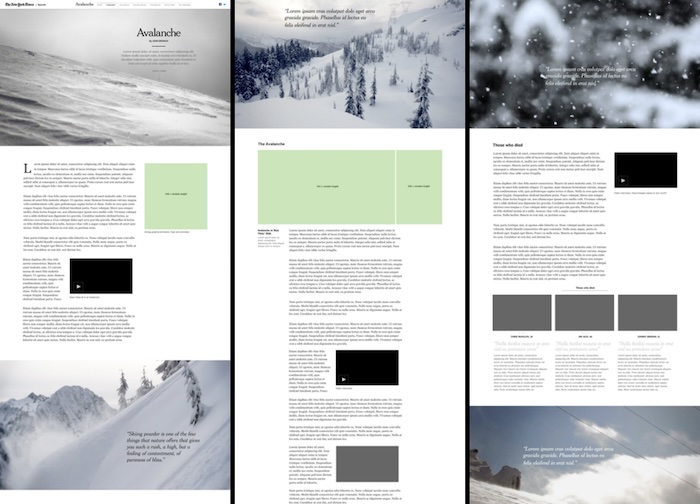
Original Storyboard Sketches
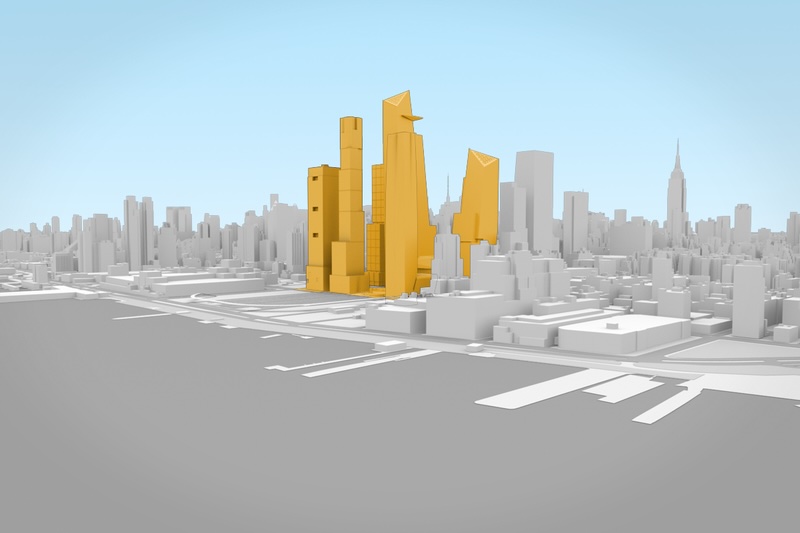
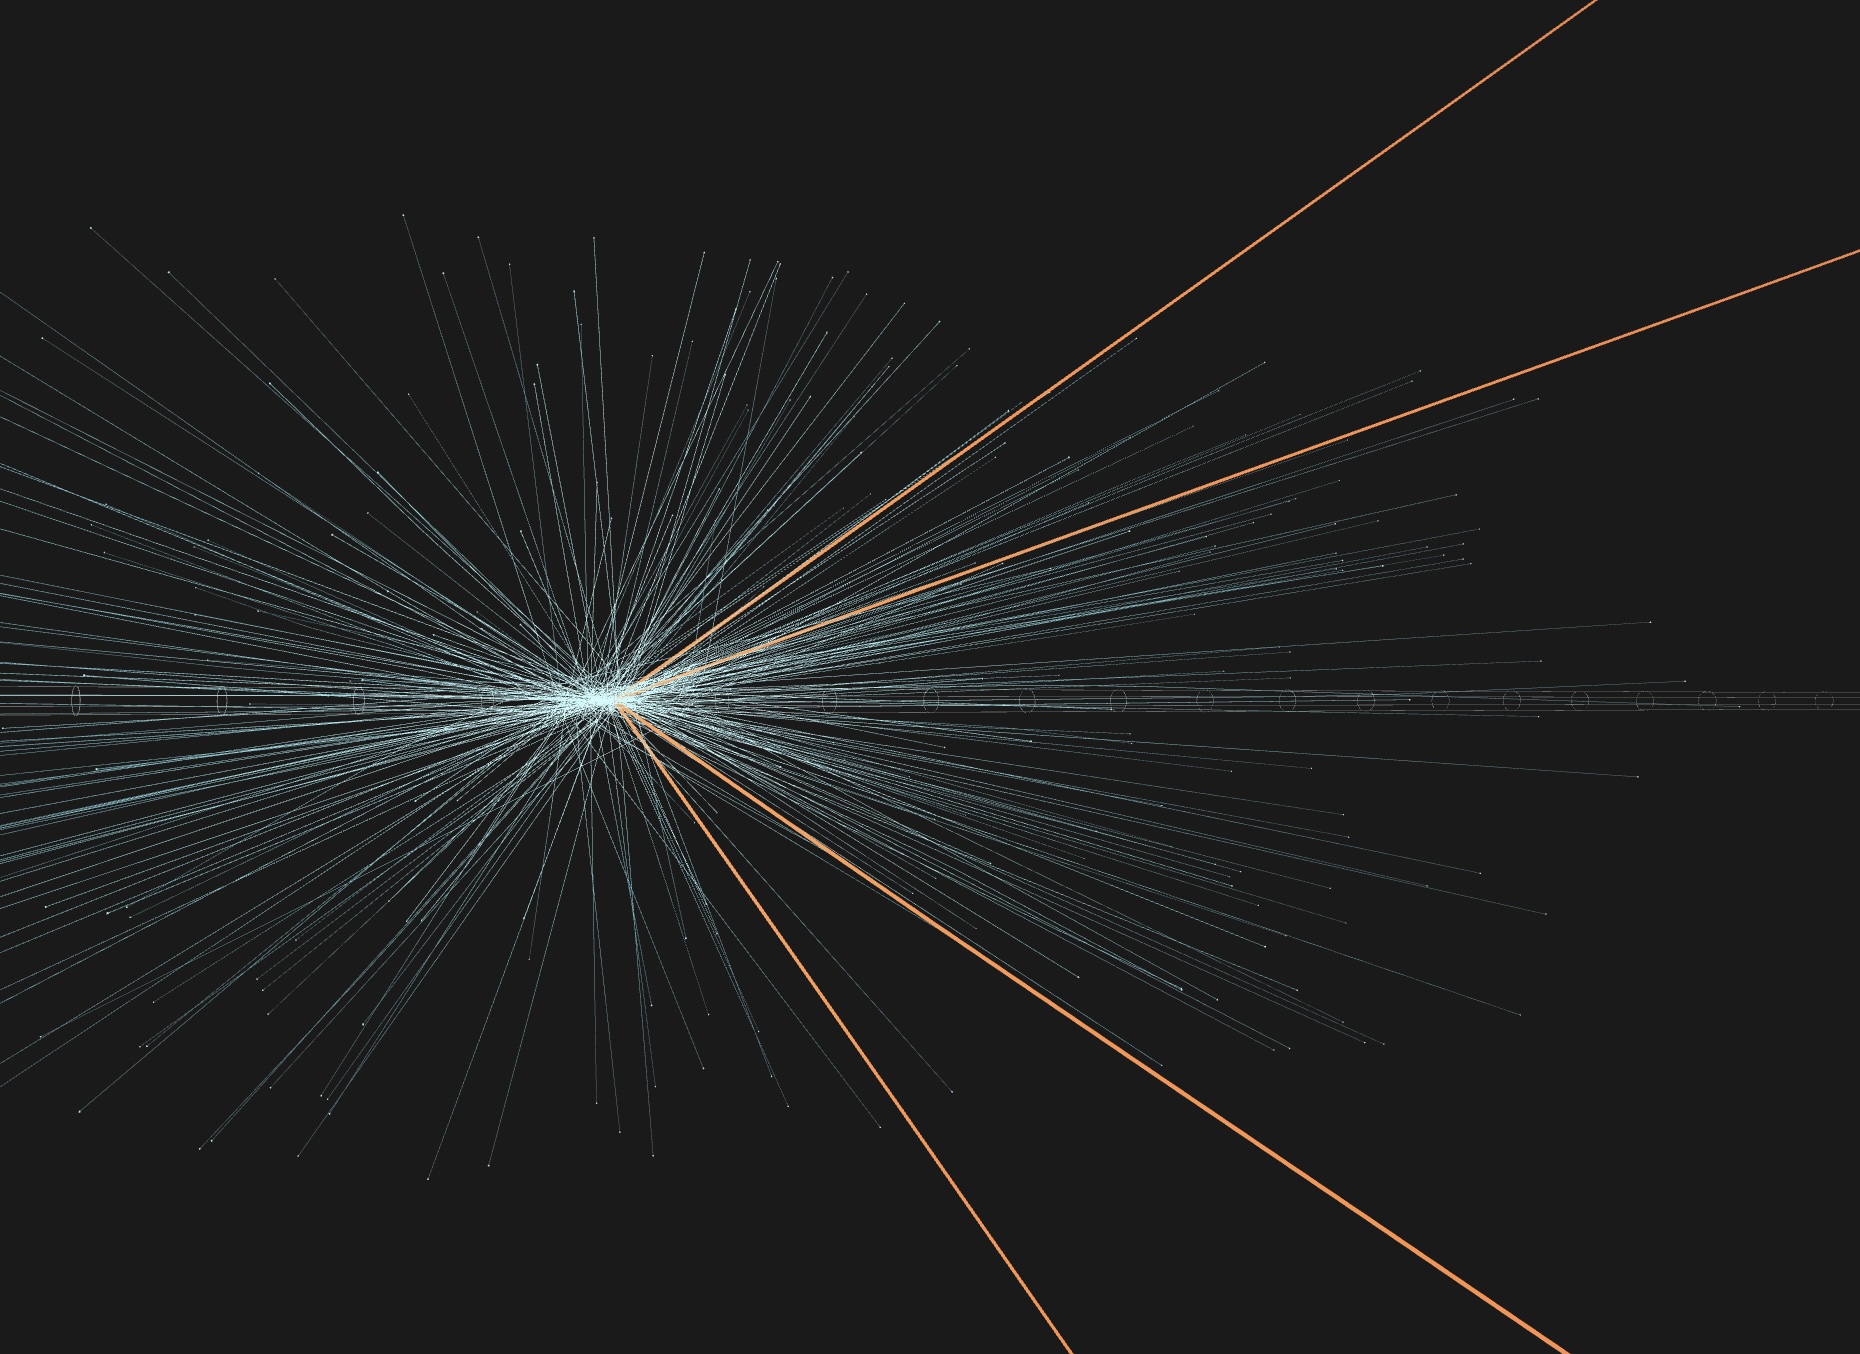
Technical InnovationWe built custom fly-throughs of the mountain range using raw elevation data, allowing readers to visualize the scale of the avalanche in a way photography alone could not convey.
"It wasn't just about making it look cool. It was about cognitive load—using motion to explain complex spatial events without interrupting the reader's flow."
Notre Dame
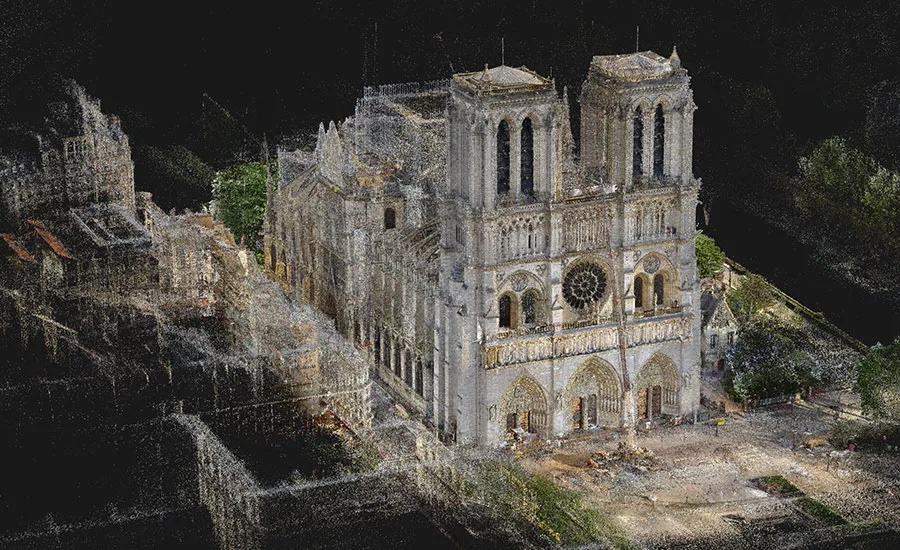
Modeling the Fire
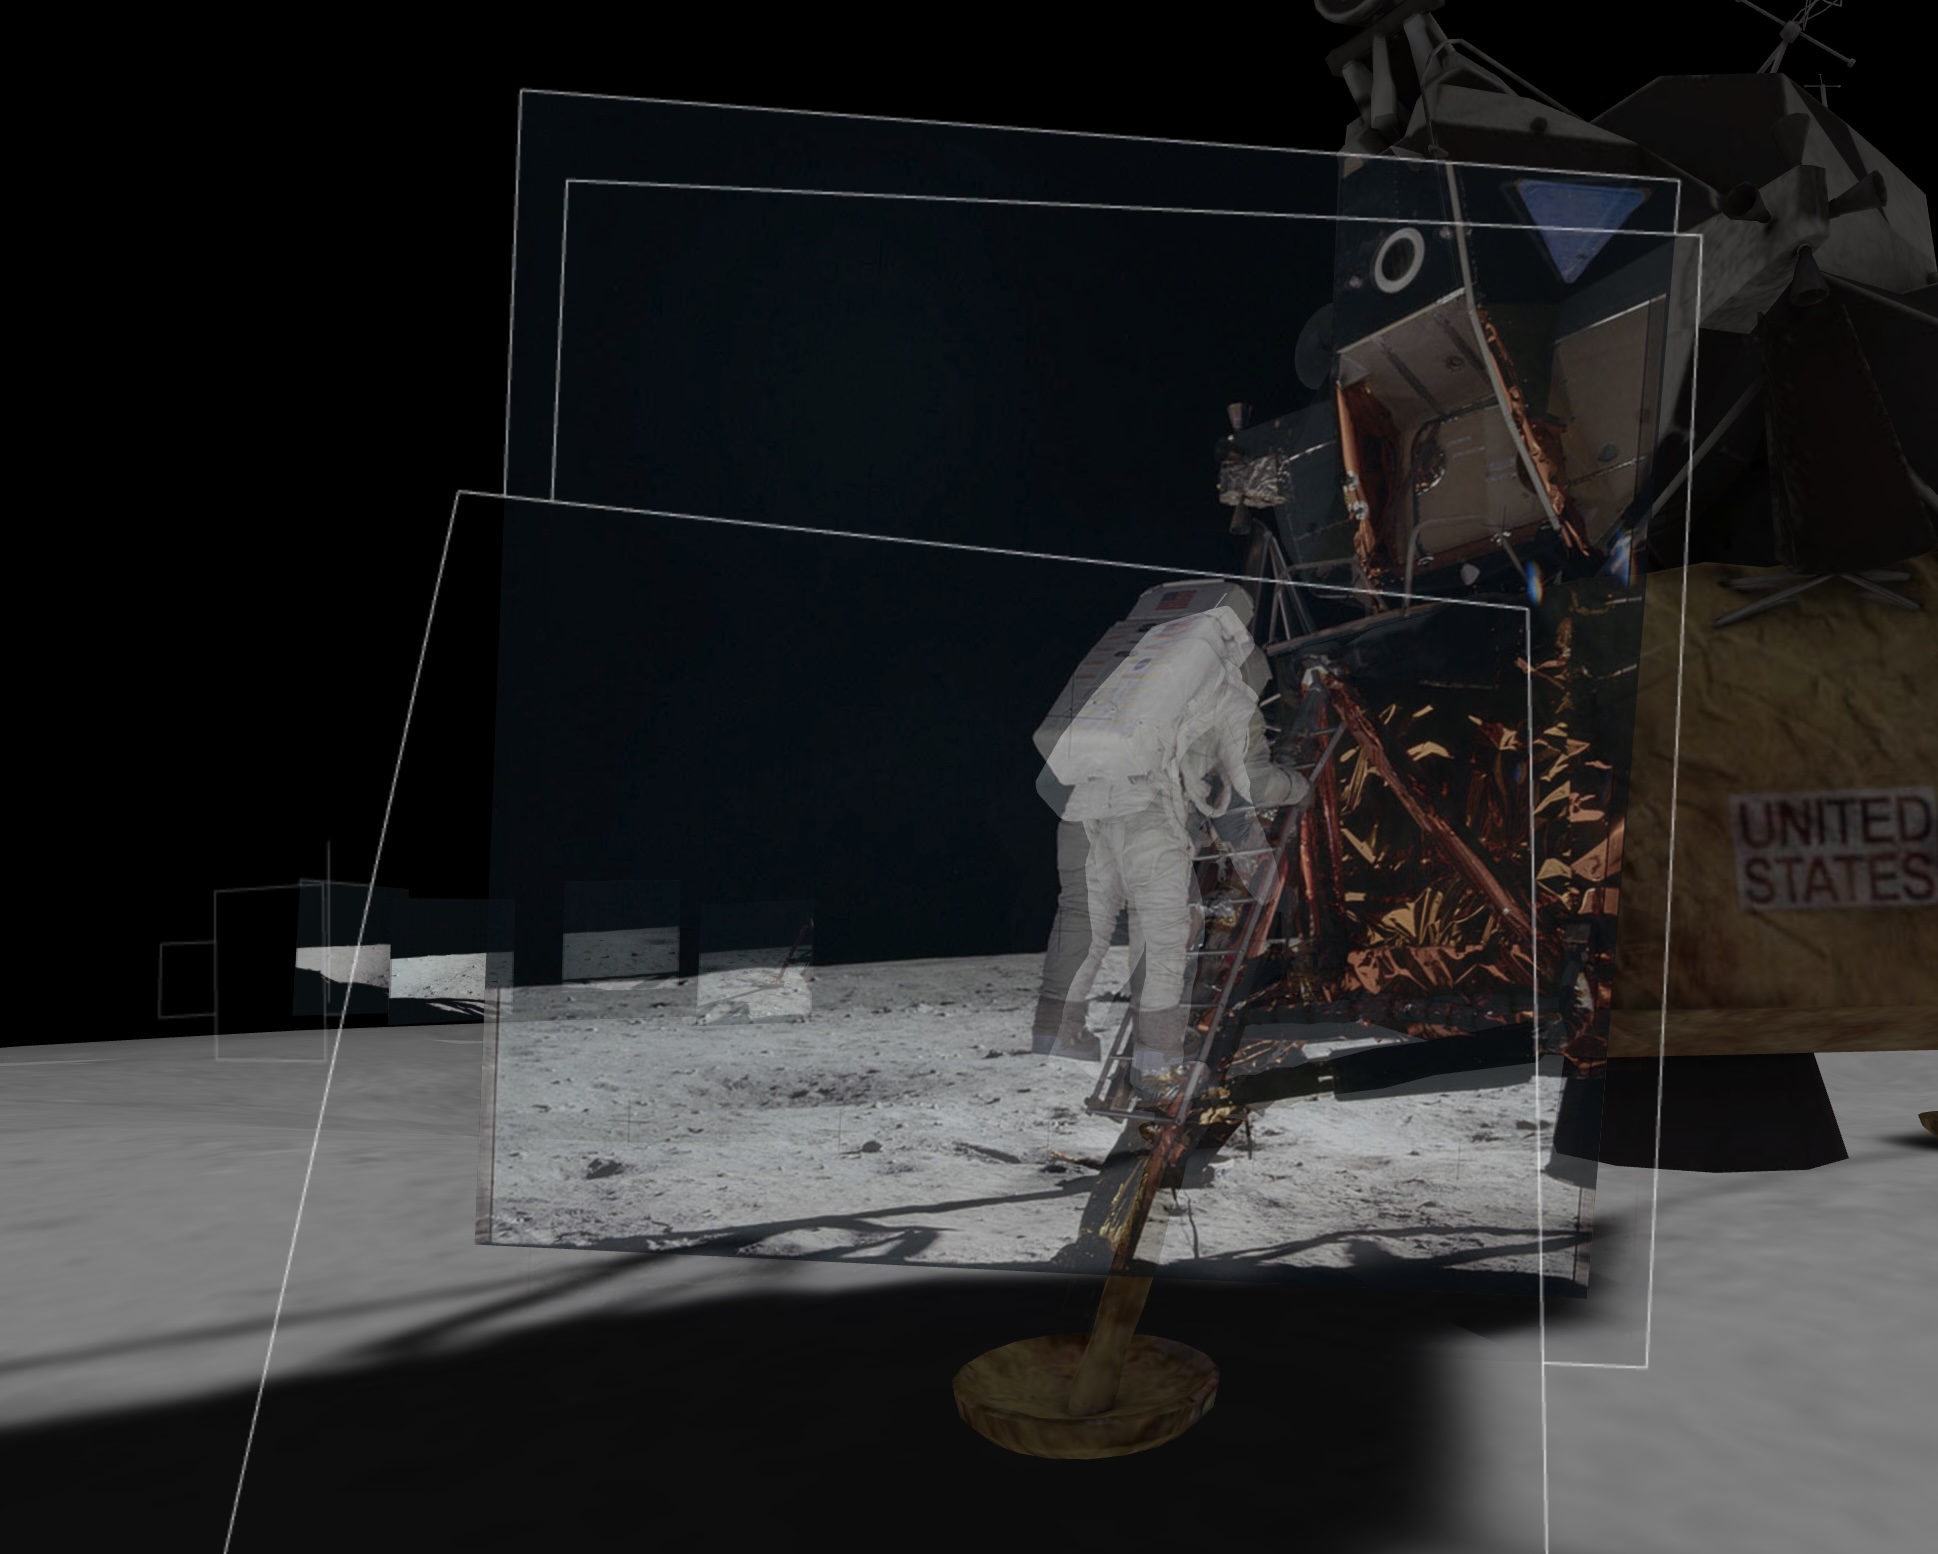
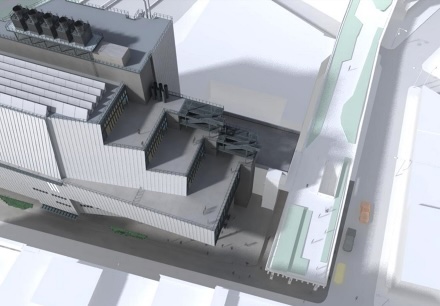
To explain how the fire spread, we utilized laser-scan data of the cathedral to build a forensic 3D model. In 2025, this work was acquired by the Museum of Modern Art for its permanent collection, recognizing its significance in the history of digital information design.
Launch Experience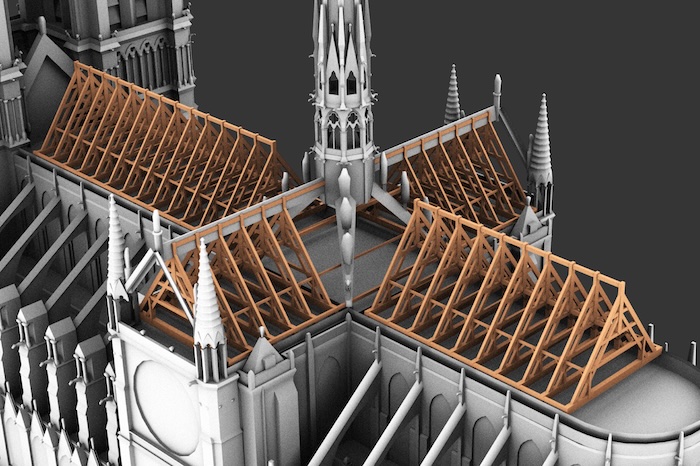
Scrollytelling 2.0
Unlike earlier projects, this piece relied on WebGL to render the cathedral in real-time within the browser, giving readers a seamless, dynamic experience that static video couldn't achieve.
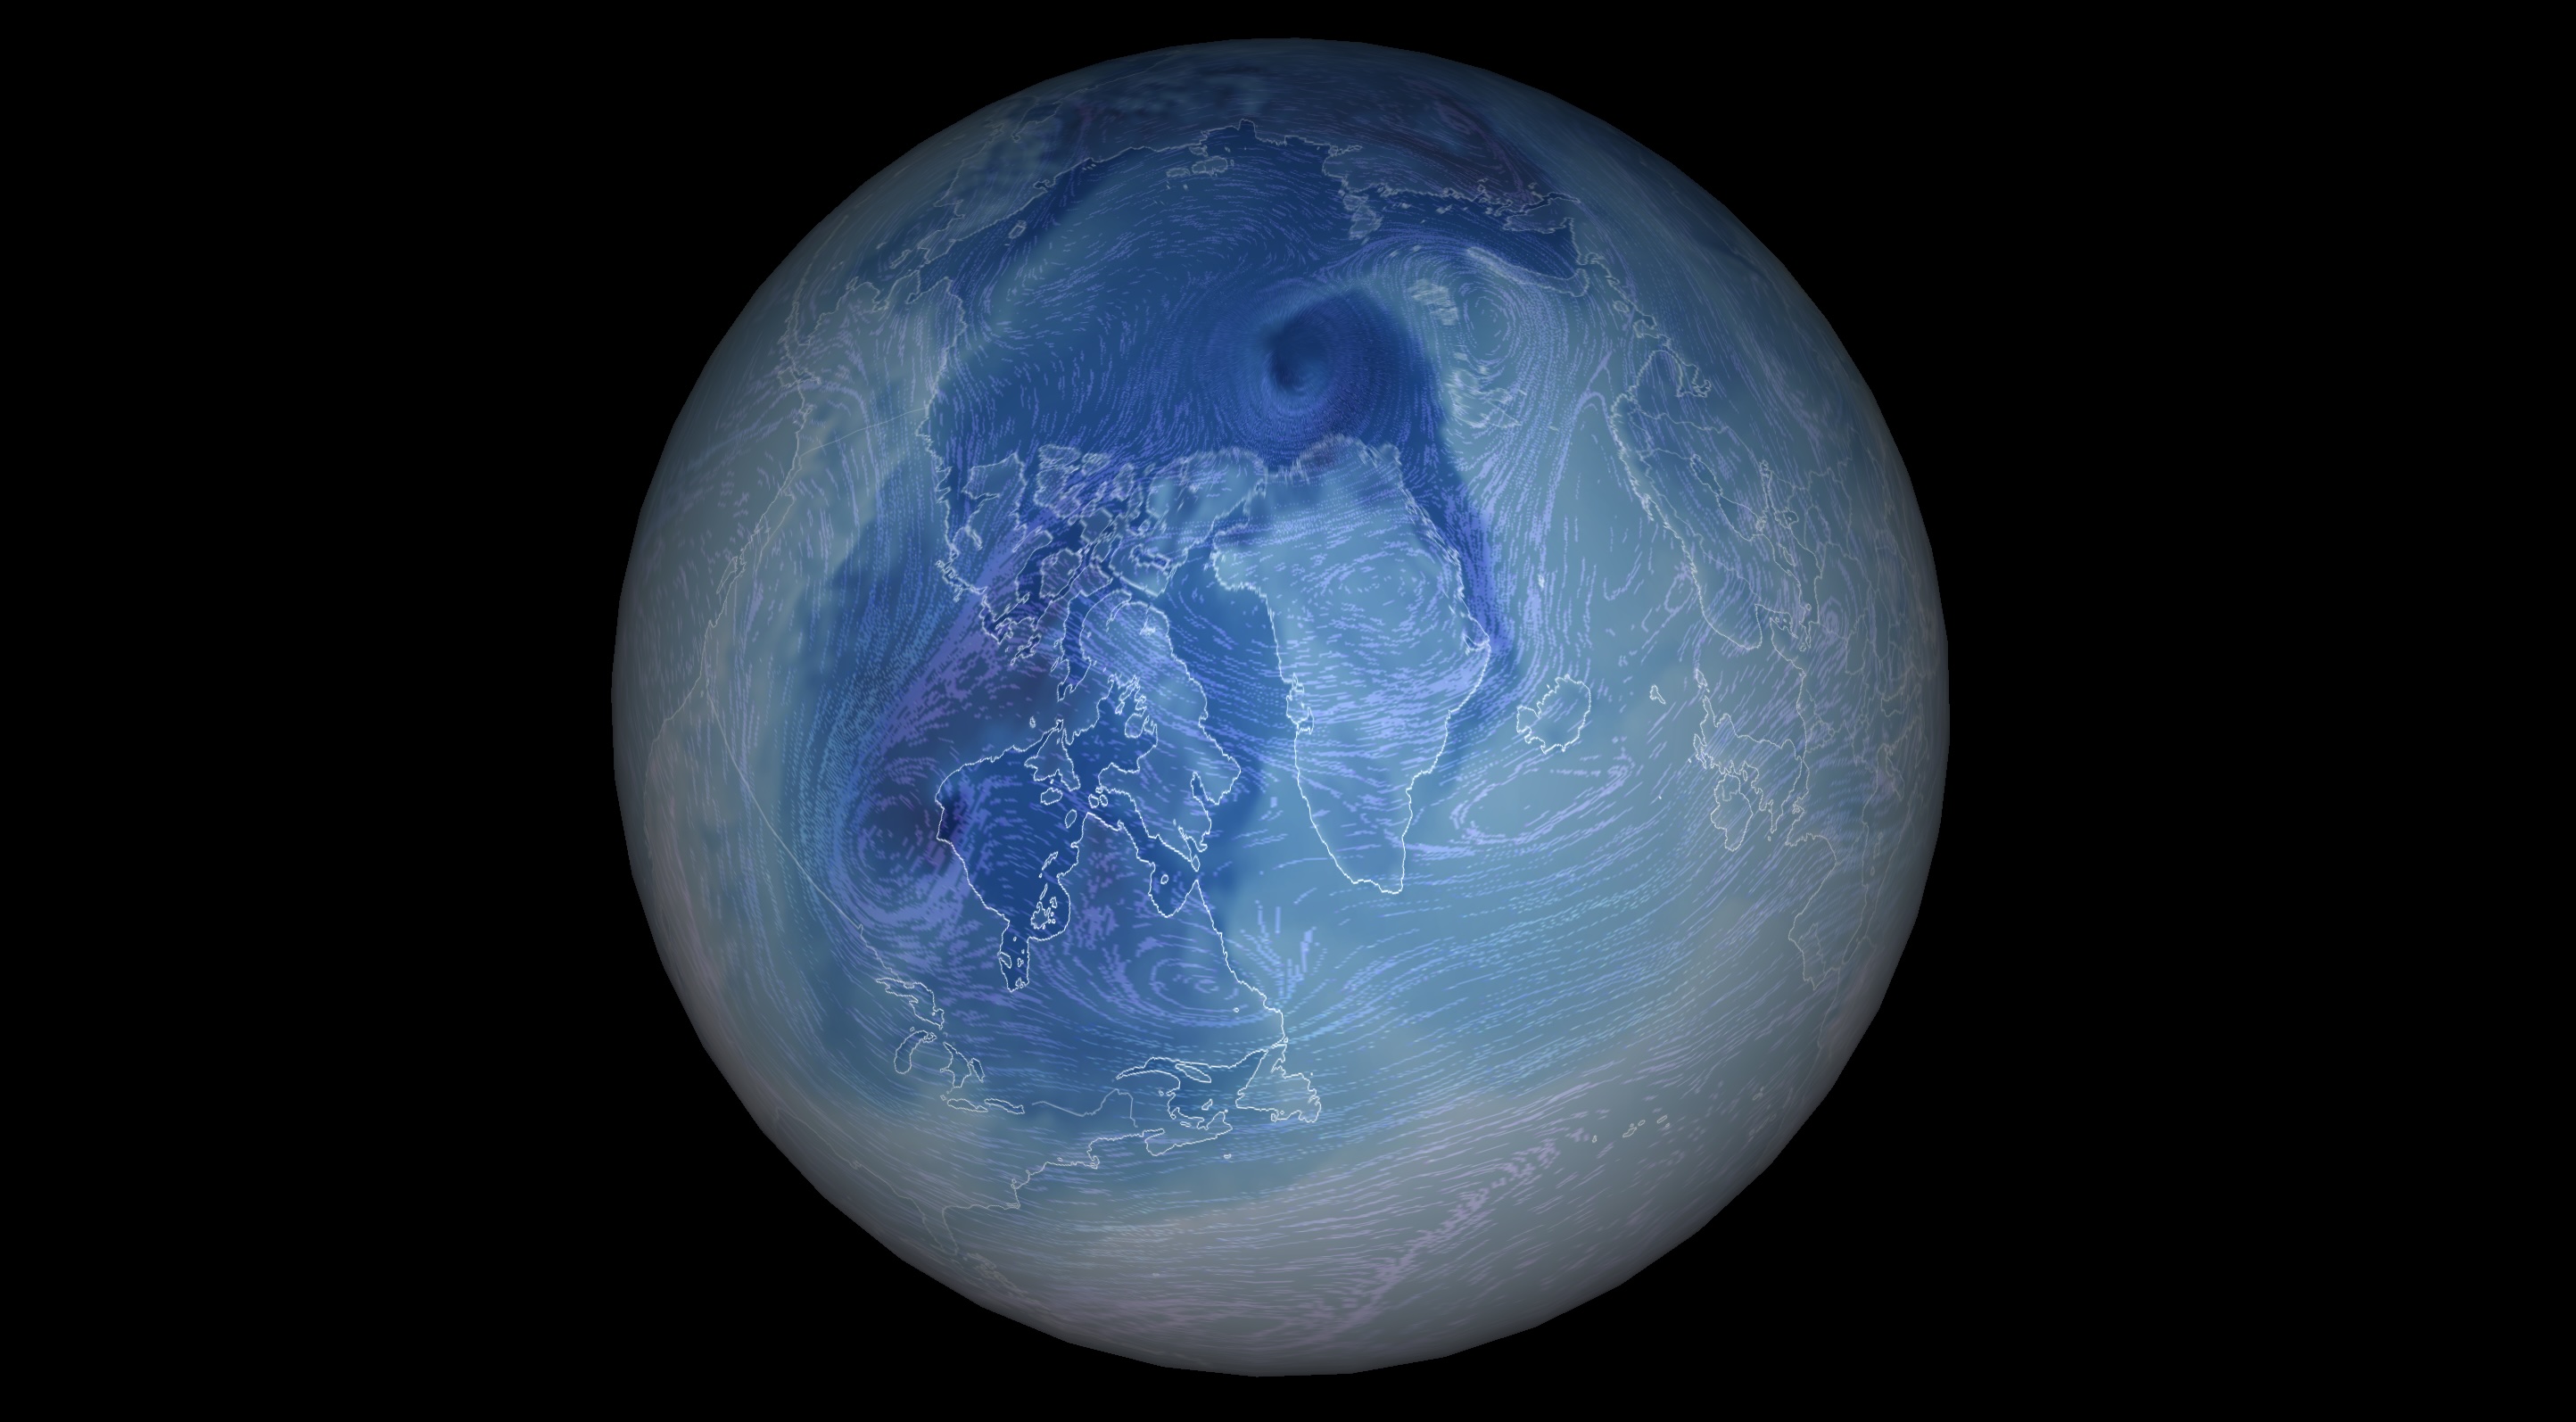
The Polar Vortex
The term "Polar Vortex" was often used in the media but rarely understood. We set out to create a definitive visual explanation of how a disruption in the stratosphere can trigger extreme cold snaps on the ground. By visualizing wind patterns and temperature data on a planetary scale, we turned a complex meteorological phenomenon into a clear, compelling narrative.
Launch Experience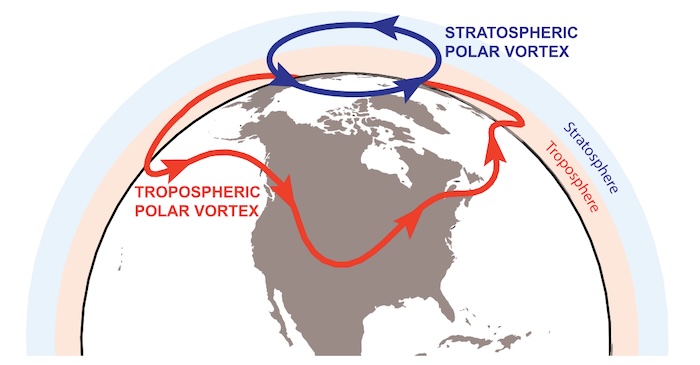
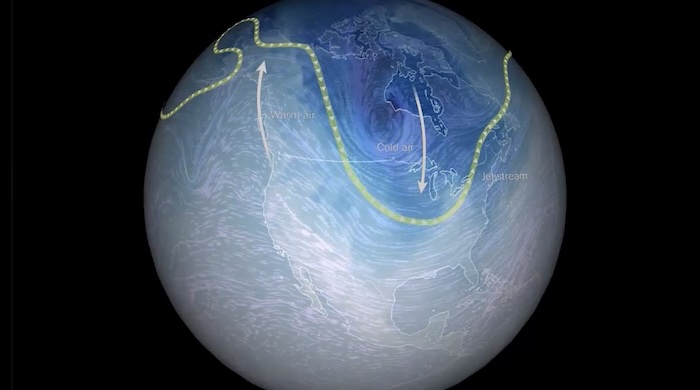
Global ScaleUsing global weather simulation data, we mapped the split of the vortex in 3D. The challenge was to maintain scientific accuracy while simplifying the visual noise of the atmosphere so readers could follow the mechanism of the split.