
The Art of
Health Data
Built a global information design practice. Exploring the intersection of biology, technology, and human understanding.
Role
EVP, Global Information Design
Focus Areas
Pharma, Biotech, AI, Patient Experience
Health data is often complex, opaque, and clinical. Our mission is to make it human, accessible, and actionable.
I led a specialized design practice within Havas that helped the world's leading healthcare companies visualize the invisible. From pitch decks to patient tools, we used high-end visual effects, 3D animation, and interactive design to show clients the "art of the possible."
Explorations
A curated collection of prototypes, motion studies, and design concepts exploring the future of health interfaces.
Disease State Education (DSE)
Interactive Charts
Interactive Dashboard
Clinical Analysis
Patient Profiles
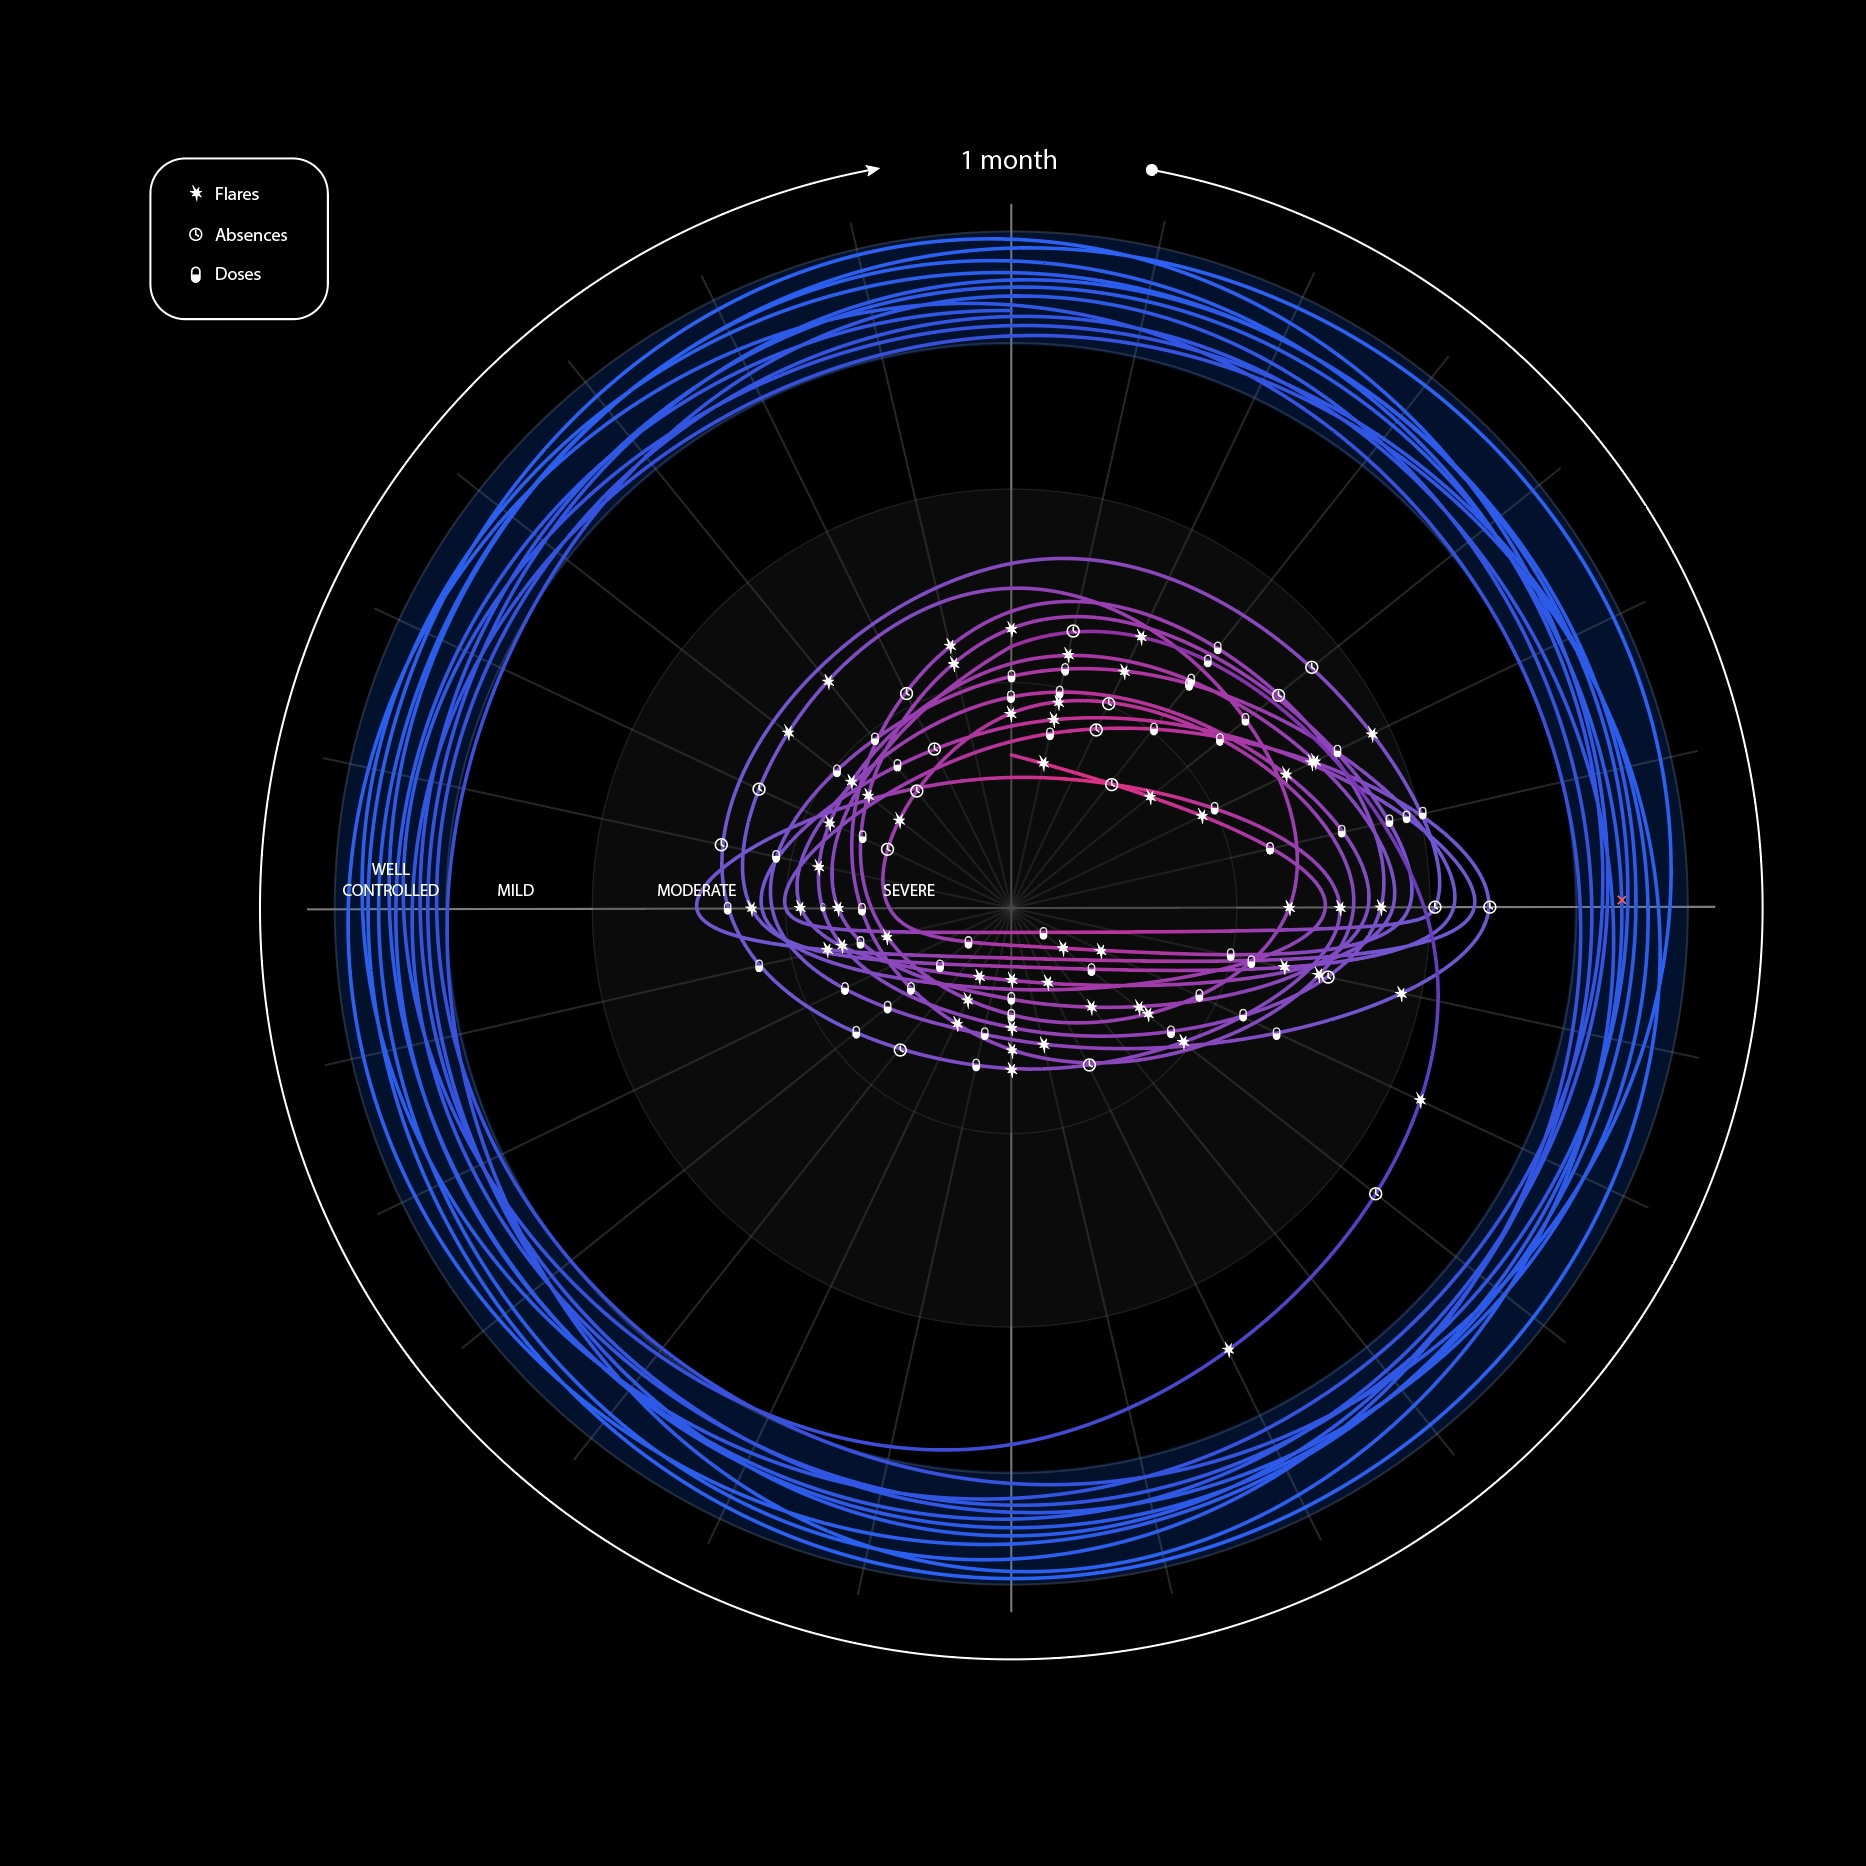
Microsphere Dynamics
Flare Visualization
Narrative charts
Clinical Trial Timeline
Radioligand Therapy
Patient Journey
Datavis Whitepaper
Dosing Visualization
Interactive Visual Aid
Code-Based Prototyping
True art direction requires moving beyond static comps. By prototyping directly with code, we can pressure-test visual systems, motion behaviors, and interactions using real data before full engineering begins.
"We are not just designing charts. We are designing understanding for critical, life-saving innovations."
Back to Selected Works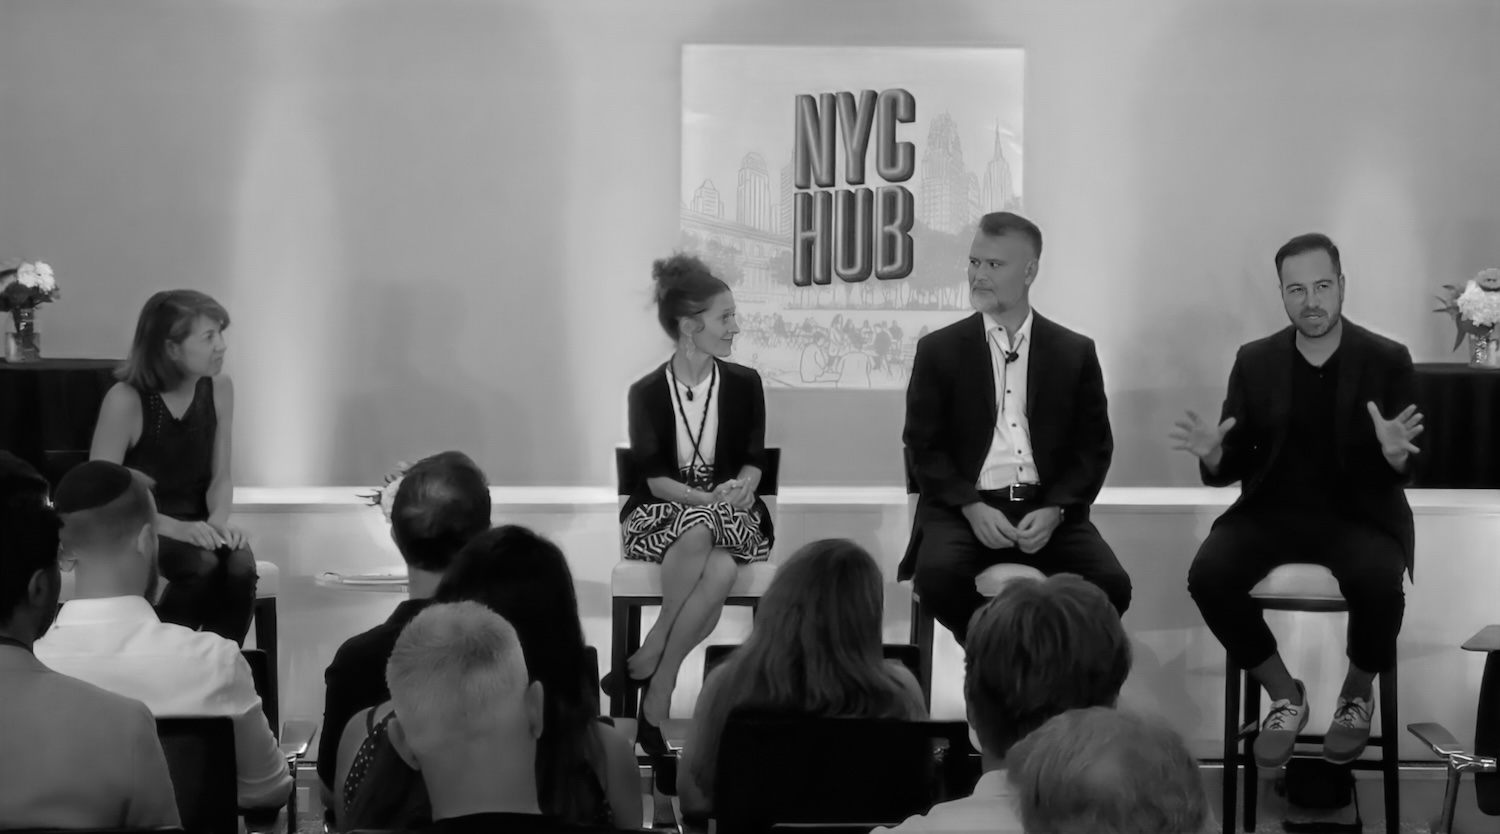
Health innovation panel at Novartis NYC hub