Visualizing the
World's Curiosity
Leading digital and experiential design for Google Trends. Turning billions of search queries into human stories.
Role
Digital Design Lead
Focus Areas
Data Visualization, Web Apps, Experiential Retail
Search data is a mirror of society. My role was to design the reflection.
As Digital Design Lead for the Google Brand Studio, I worked to transform the raw utility of Google Trends into emotional, narrative-driven experiences. This involved spanning the digital and physical worlds—from responsive web applications to immersive installations at the Google Store.
Space to Belong
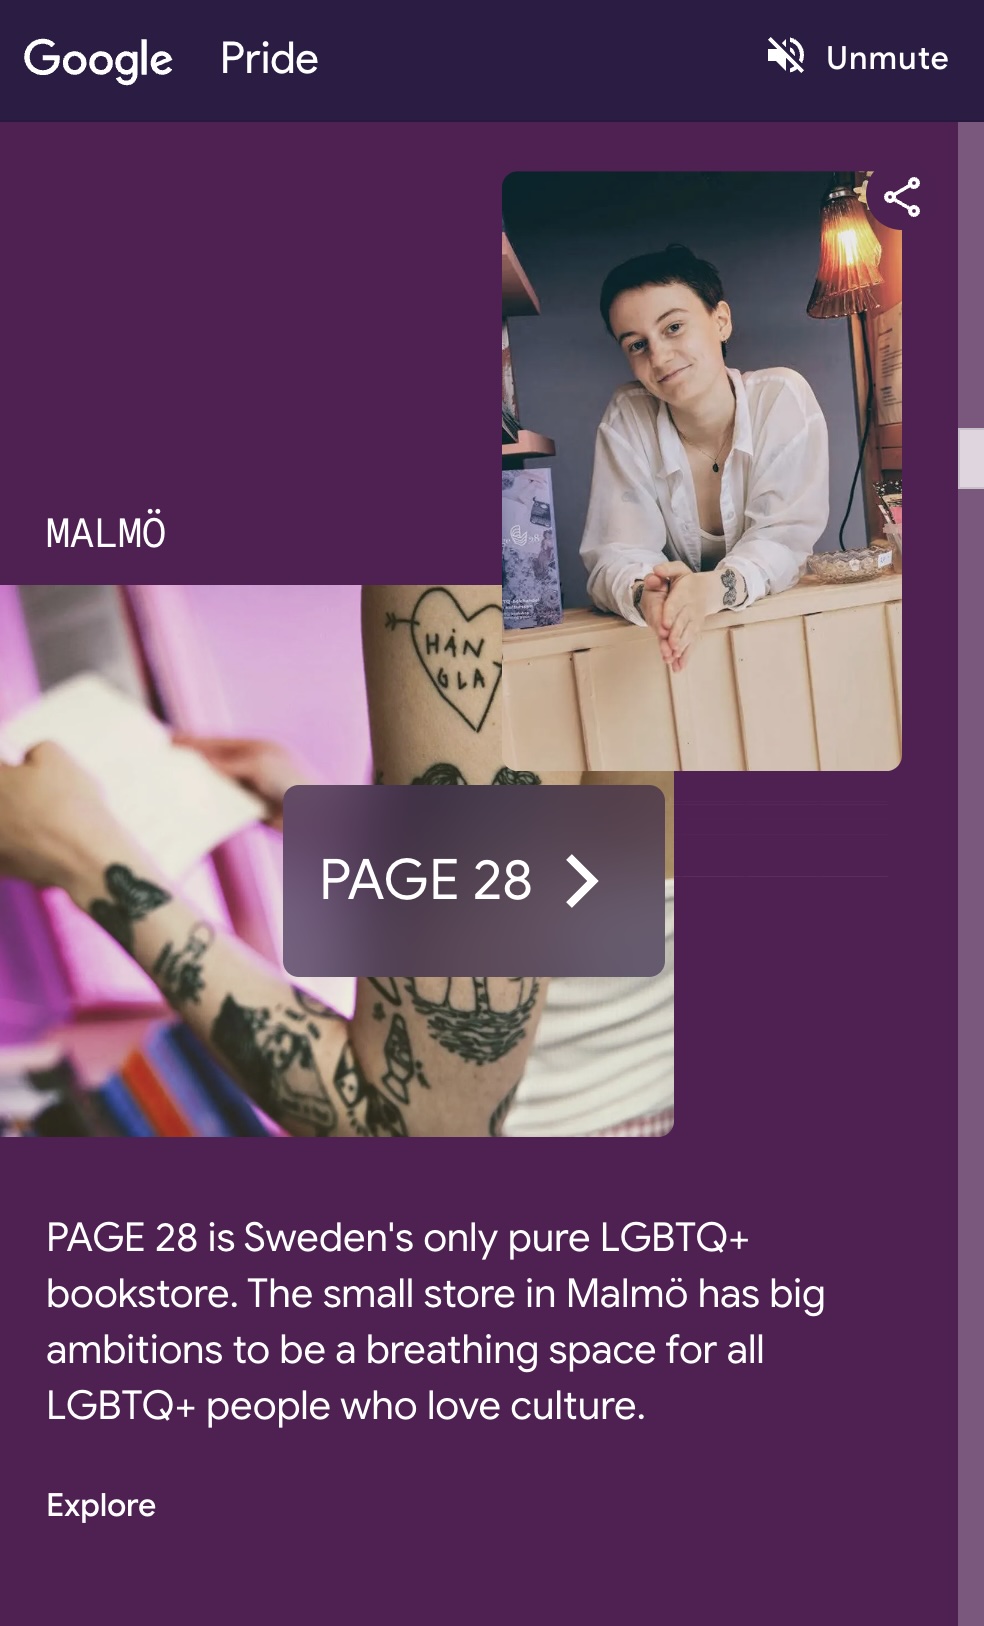
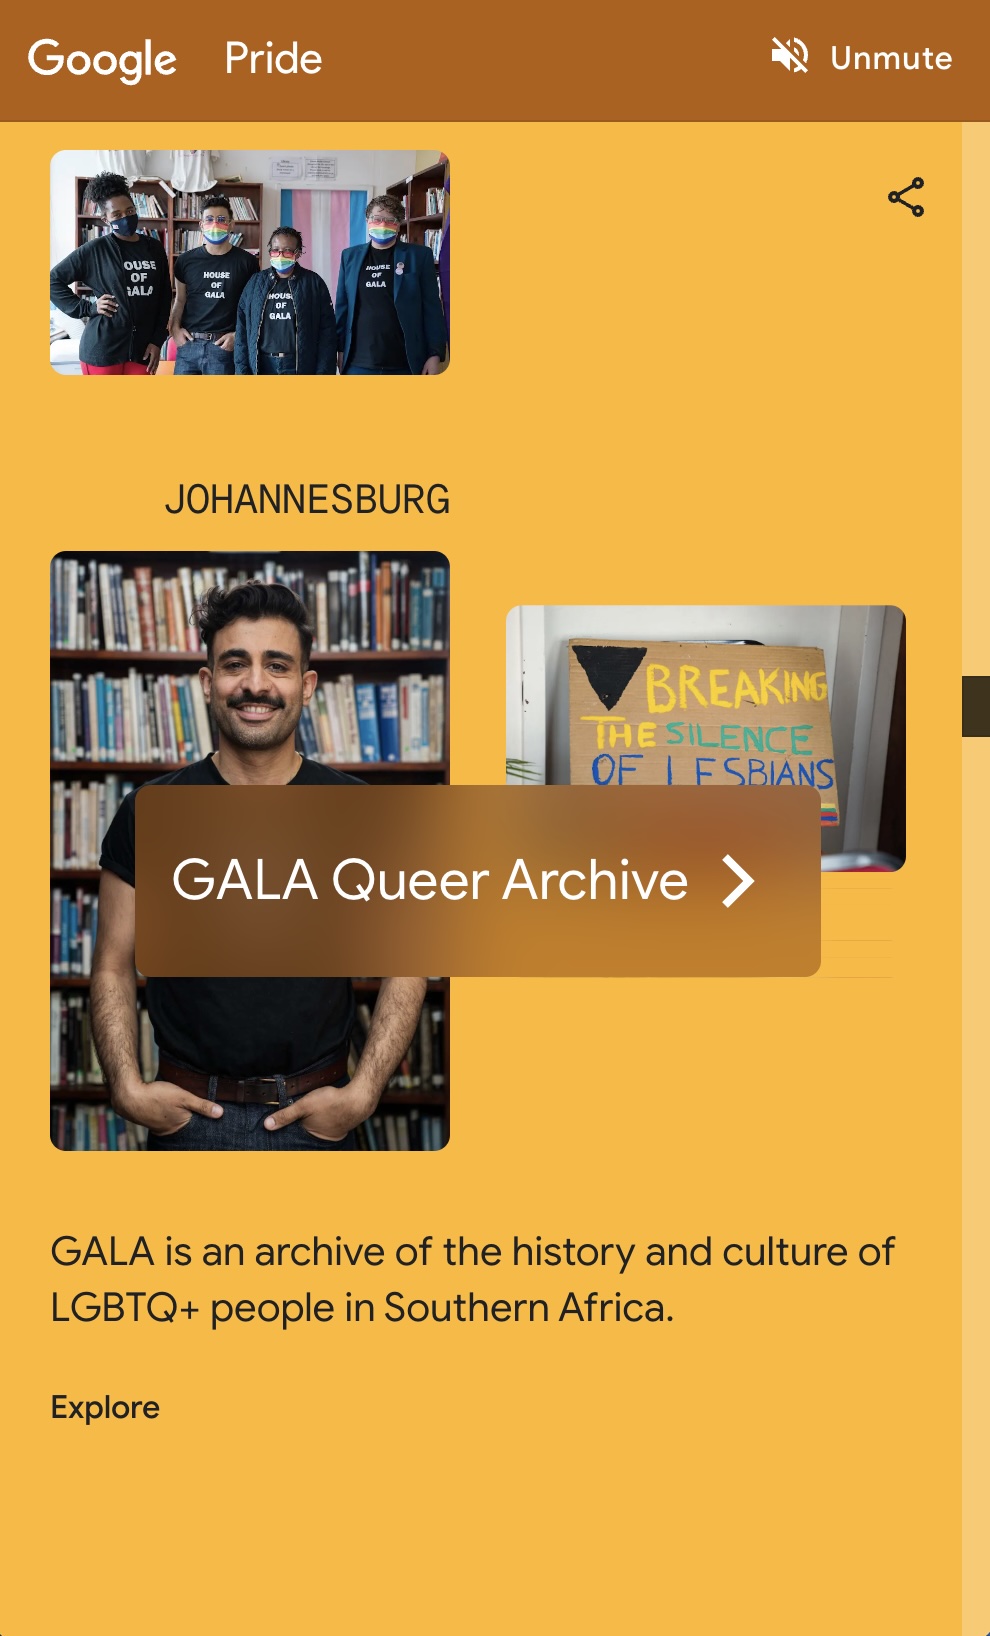
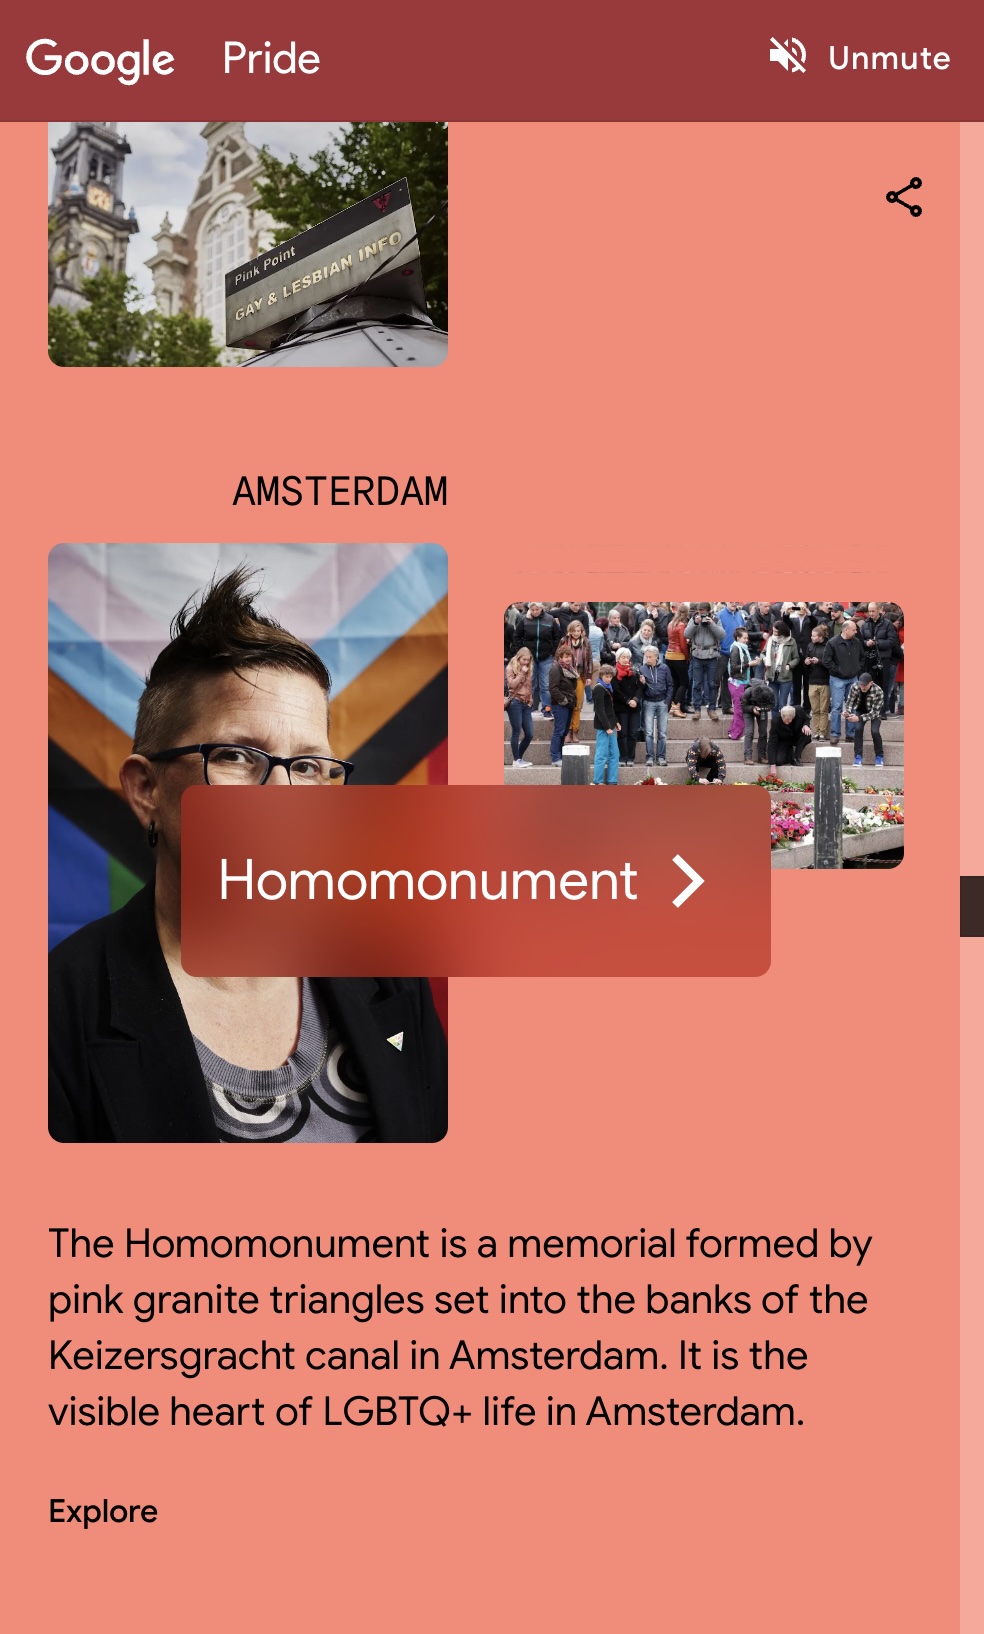
For many, finding a safe space is a challenge. "Space to Belong" utilizes Google Trends data to visualize the global search for community. We mapped queries related to inclusive spaces—from "LGBT friendly cities" to "transgender safe spaces"—creating a responsive web experience that highlights the universal human need for connection and safety.
Immersive Audio
The concept was an immersive experience with photography and short audio-clip interviews with owners and patrons.
We paid extra attention to accessibility, and wanted the experience to still feel like an audio experience, even when users chose to have sound off. Rather than create an accessibility button, we worked captions into the design from the start as a highly considered element of the overall experience.
Expressive Captions
Born from the accessibility work in "Space to Belong," this project asked a simple question: What if captions could emote?
After conducting over 100 hours of interviews with type experts and machine learning engineers, we developed a system where captions visualize the volume, pitch, and intonation of speech. This feature was championed by Google's Head of Accessibility and launched on Android in 2025.
Read the StoryYear in Search
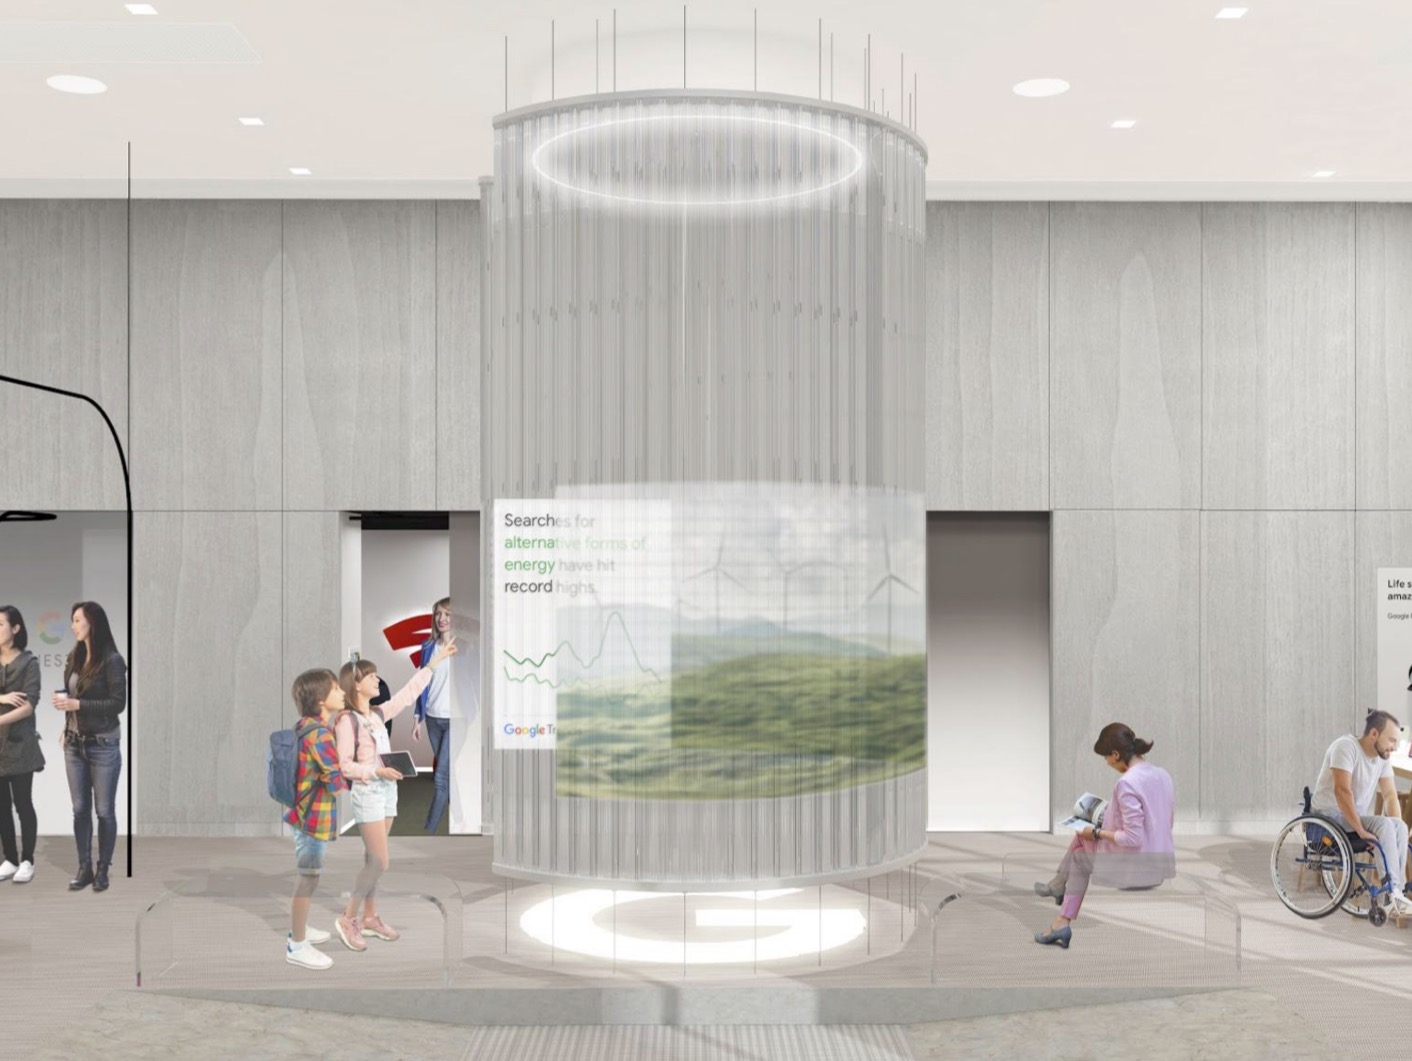
In 2021, Google opened its first brick and mortar retail store in the Chelsea neighborhood of New York City. The store features a new experience space called "The Imagination Space."
As an extension of the popular annual "Year in Search" series, I led our first out-of-home installation version of the project, creating an interactive experience that allowed visitors to use voice control to explore the trending searches throughout the year that defined culture.
Fabrication
We worked with a unique custom "imagination space" that included floor-to-ceiling glass tubes containing LEDs which we designed to reflect the data visualizations in the main displays.
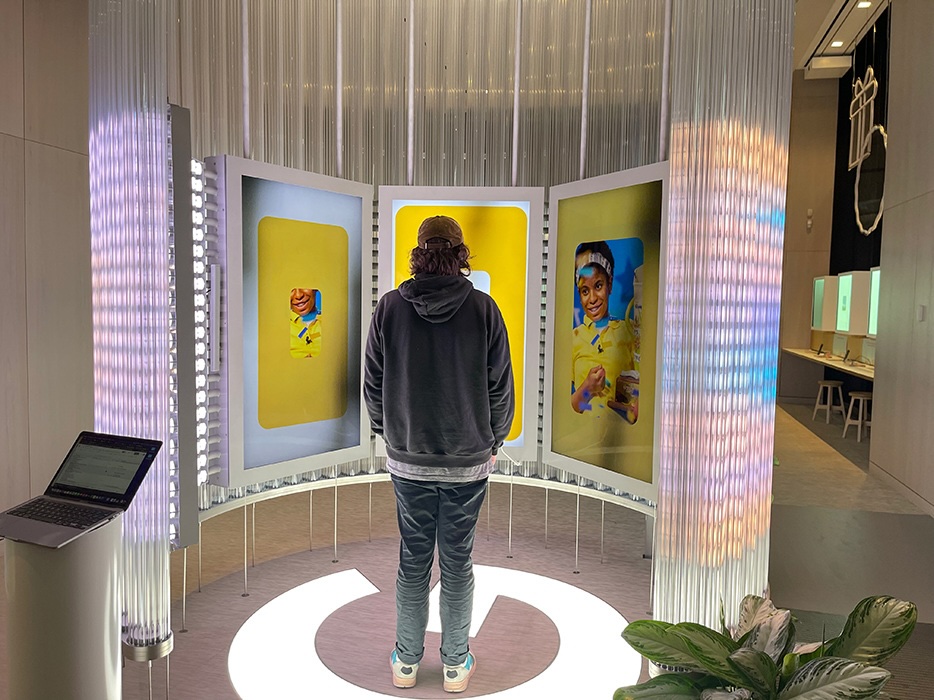
Interface Design
The interface needed to be legible and engaging from a distance to attract passersby, while offering deep interactivity for users standing directly in front of the screens.
Reimagining
Google Trends
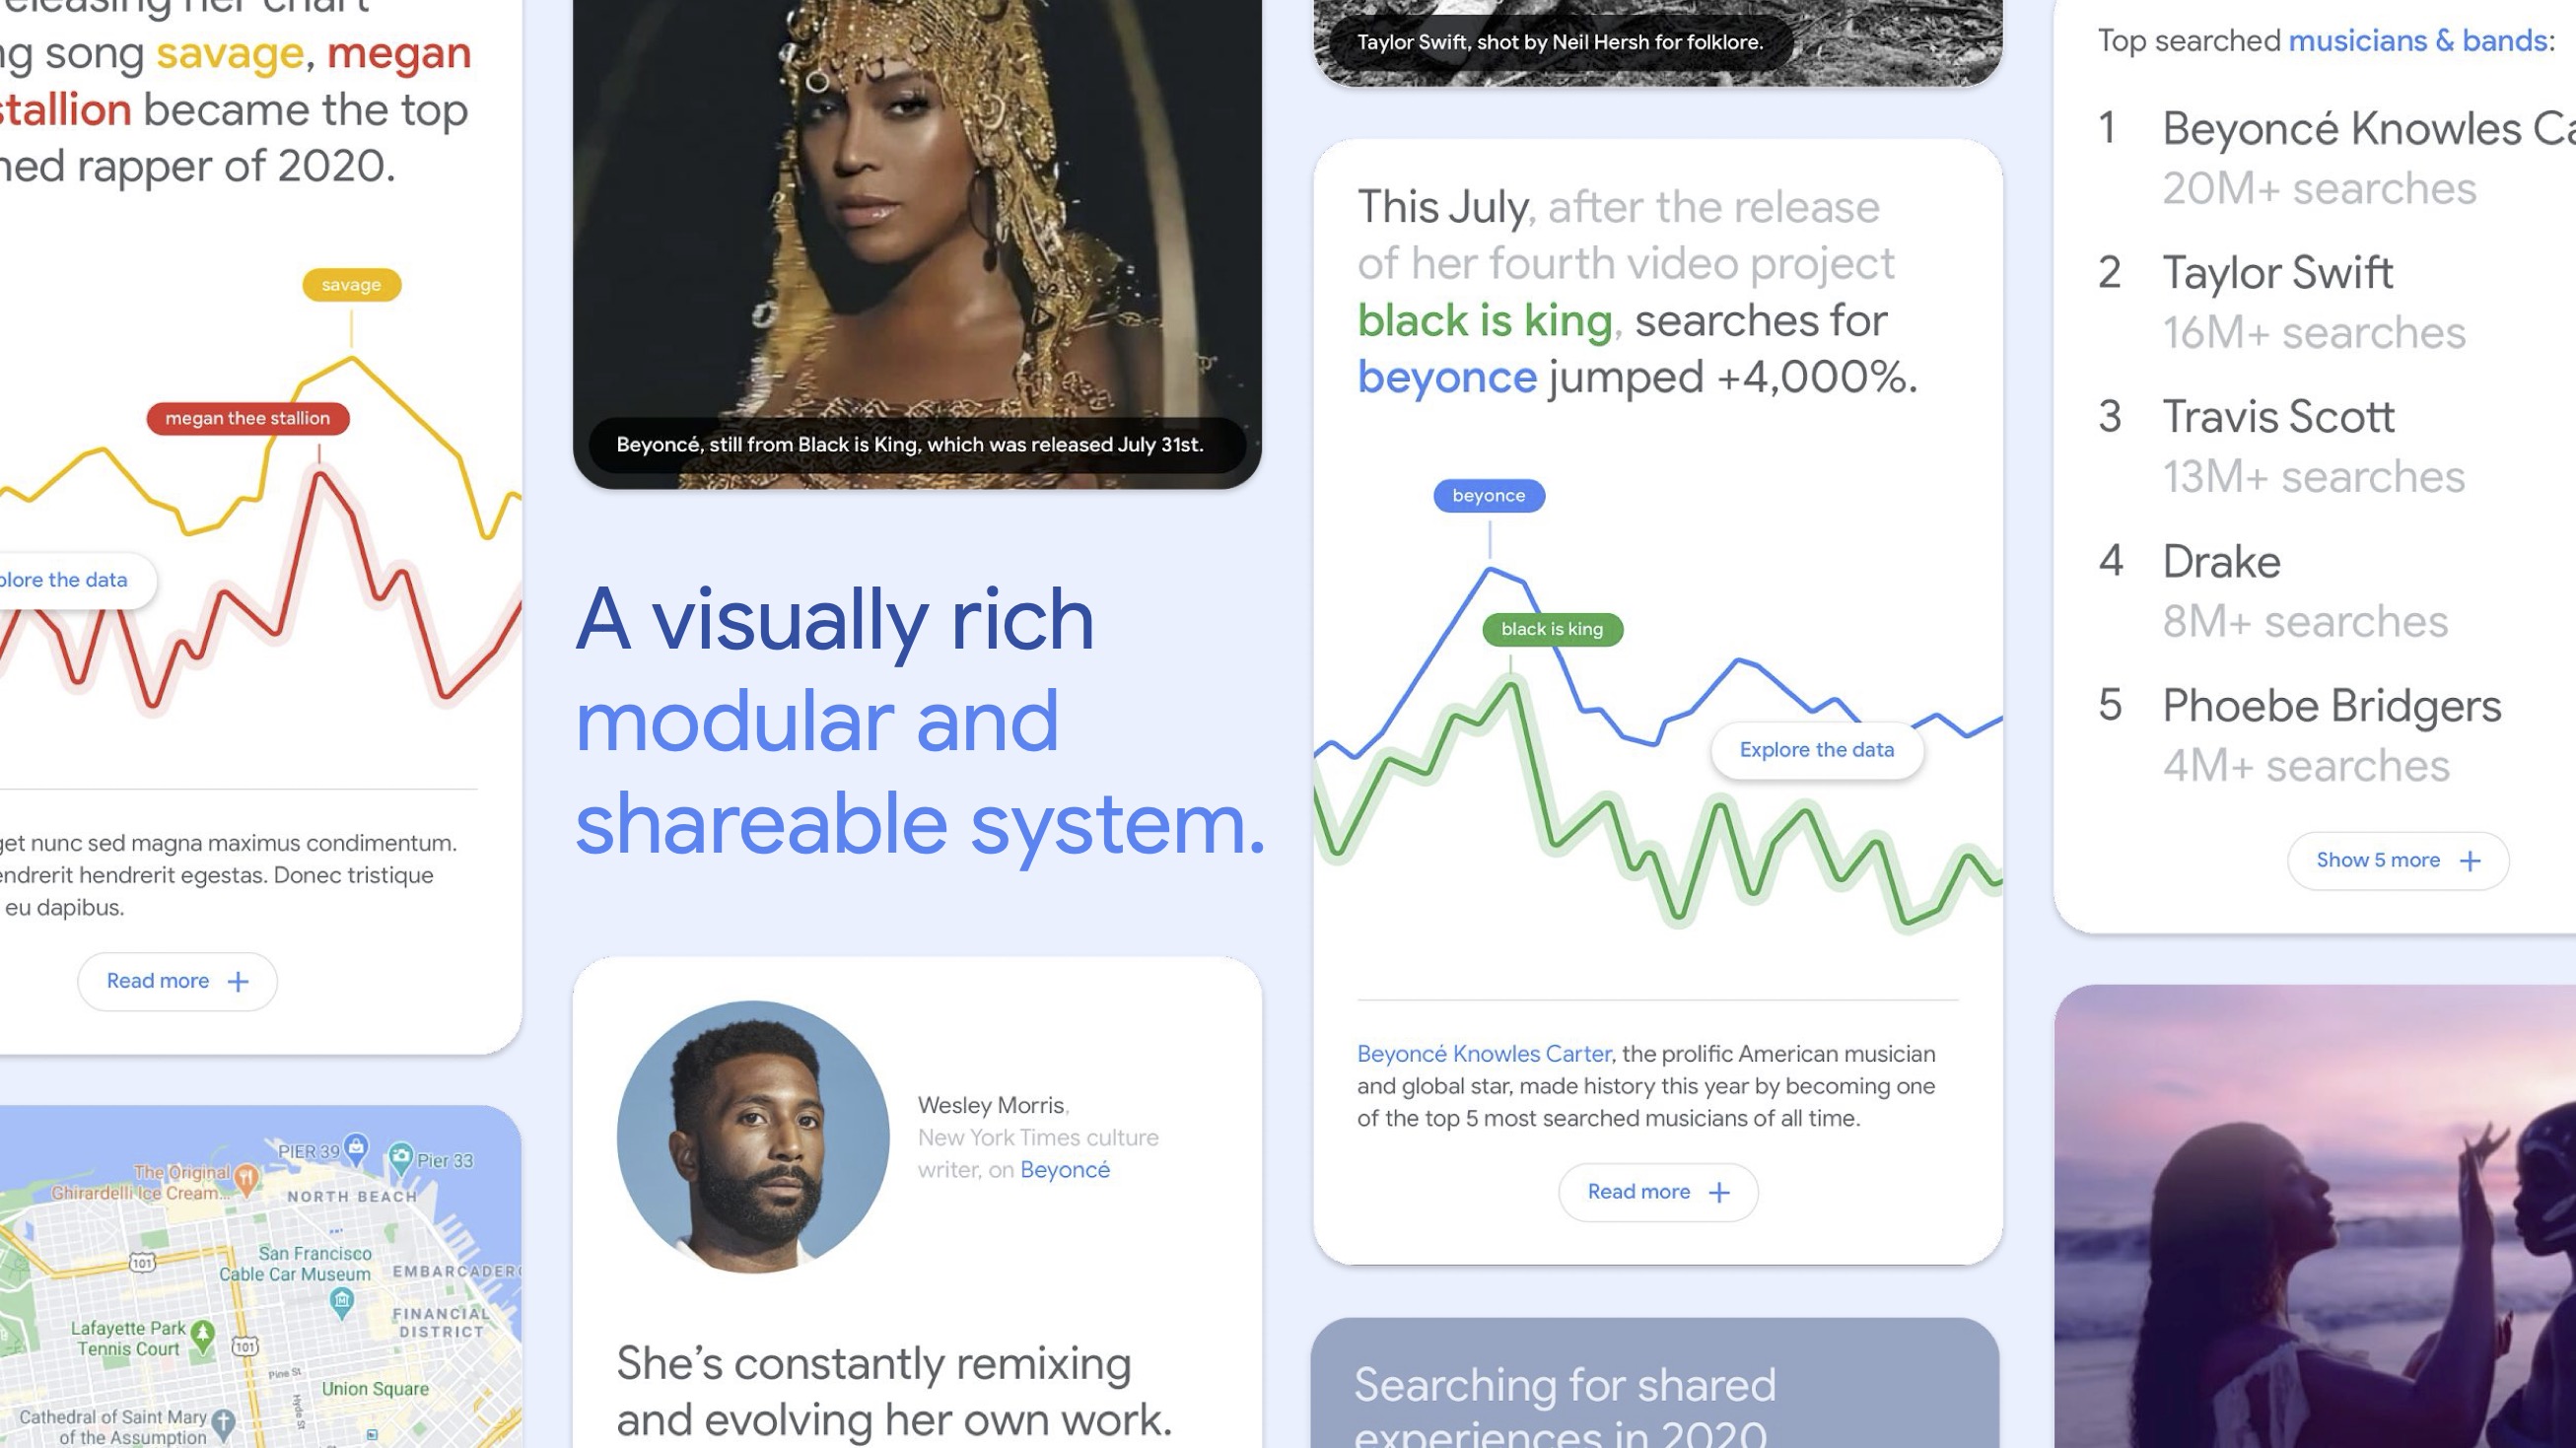
Google Trends was built for researchers, but our data showed that a significant portion of users were coming for "fun and curiosity." This strategic redesign aimed to pivot the platform from a "pull" utility into a "push" media destination, surfacing culture as it happens.
The Atomic Unit
We atomized trends data into "Snippets"—portable, shareable cards that tell a single data story.
Instead of forcing users to query a database, Snippets allowed Google to meet users where they were—on social media and third party sites. These self-contained units could host live charts, images, and lists, transforming raw data into social objects.
Trends Studio
To scale this new ecosystem, we designed the "Google Trends Studio"—a creator tool for democratization.
This platform would allow partners, journalists, and creators to build their own verified data visualizations using Google's live data, without needing a data science degree. It included customizable templates and automated data validation to ensure accuracy.